Goma Gateway – Modern, Lightweight API Gateway & Reverse Proxy
I'm a Software Engineer passionate about building scalable systems and simplifying infrastructure through open source. With over 5 years of hands-on experience, I specialize in Go (Golang), Kotlin, Spring Boot, and Linux-based systems, with a strong DevOps foundation in Docker, Kubernetes, and CI/CD automation.
I'm the author of several open source tools, including:
- PG-BKUP – PostgreSQL backup and restore
- MYSQL-BKUP – MySQL backup and restore solution
- Goma Gateway – Declarative API Gateway and reverse proxy
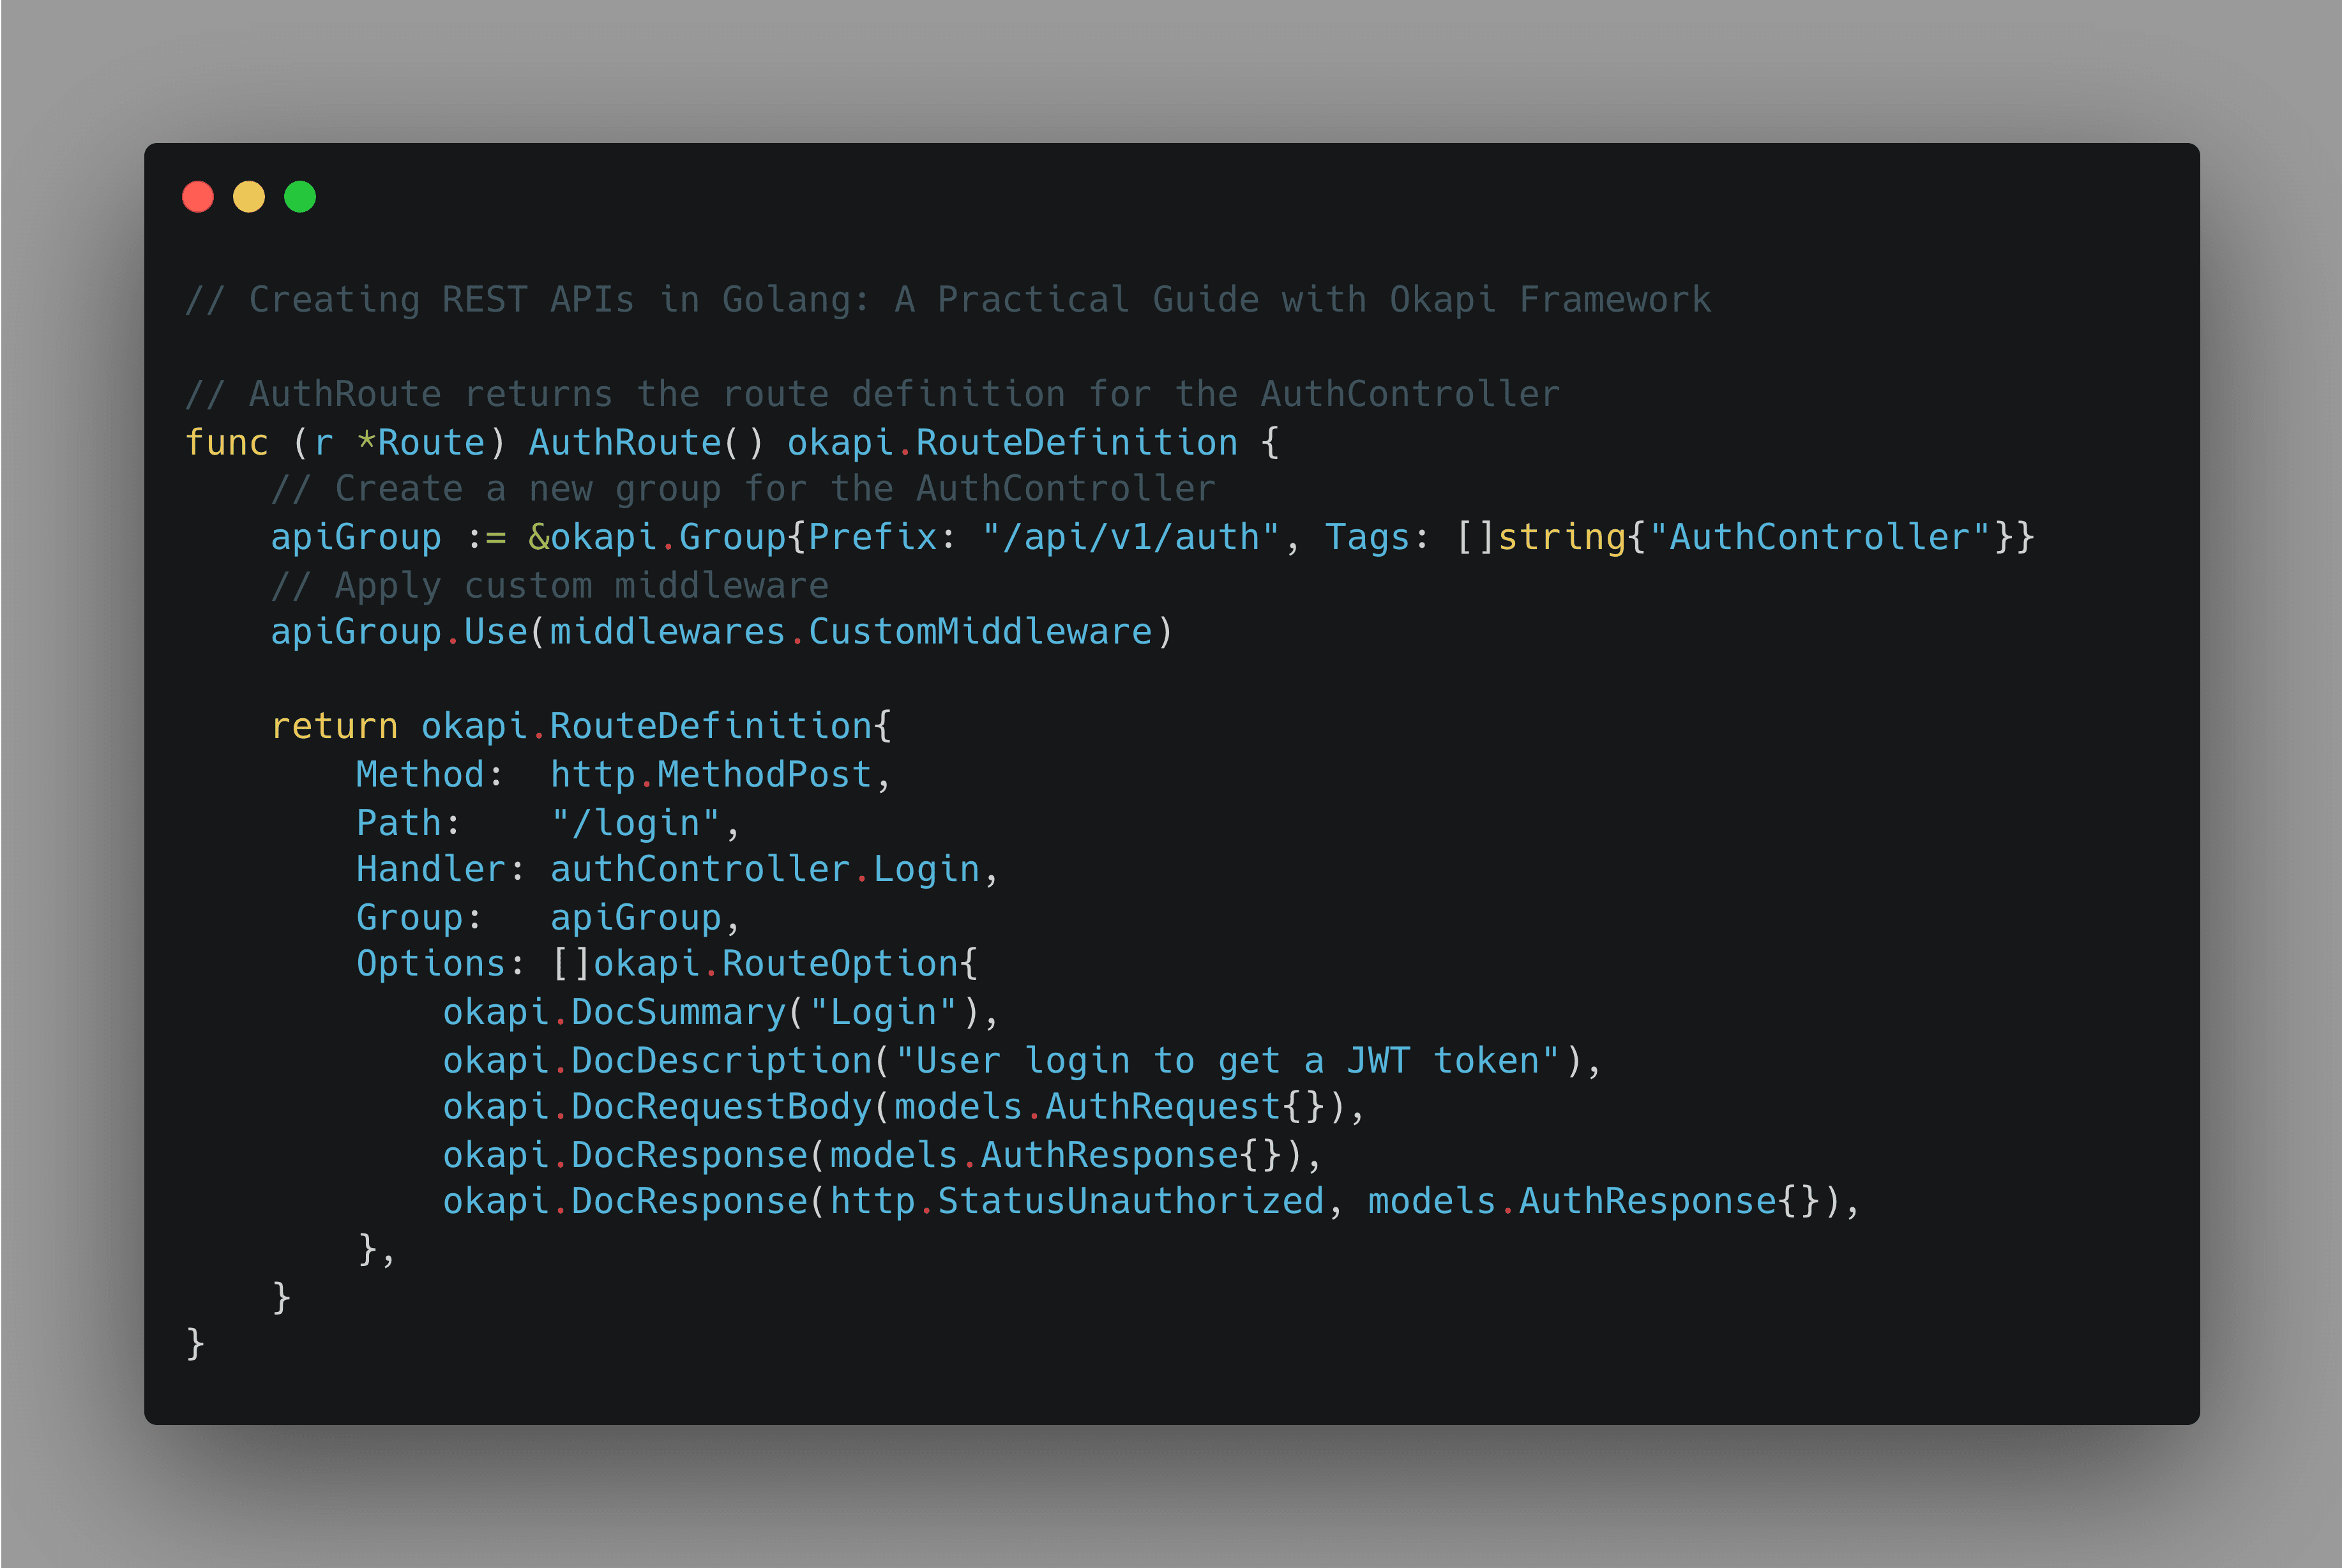
- Okapi – Fast and extensible web framework in Go
My focus is on building developer-friendly tools that are lightweight, portable, and production-ready.
Areas of Focus:
- Cloud-native architecture & API design
- Developer tooling & platform engineering
- DevOps, GitOps, and SRE best practices
- Secure infrastructure & automation workflows
Open source is at the core of my work. I thrive in both independent and collaborative environments, always aiming for clean code, thoughtful design, and real-world impact.
Goma Gateway - A Lightweight API Gateway & Reverse Proxy with Declarative Config and Powerful Middleware
Introduction
Goma Gateway is a high-performance, security-focused API Gateway built for modern developers and cloud-native environments.
It combines an intuitive declarative configuration system with powerful middleware and first-class observability, helping you route, secure, and scale traffic effortlessly.
Whether you’re managing microservices, securing public APIs, or modernizing legacy systems, Goma Gateway delivers flexibility without unnecessary complexity.
Architecture:
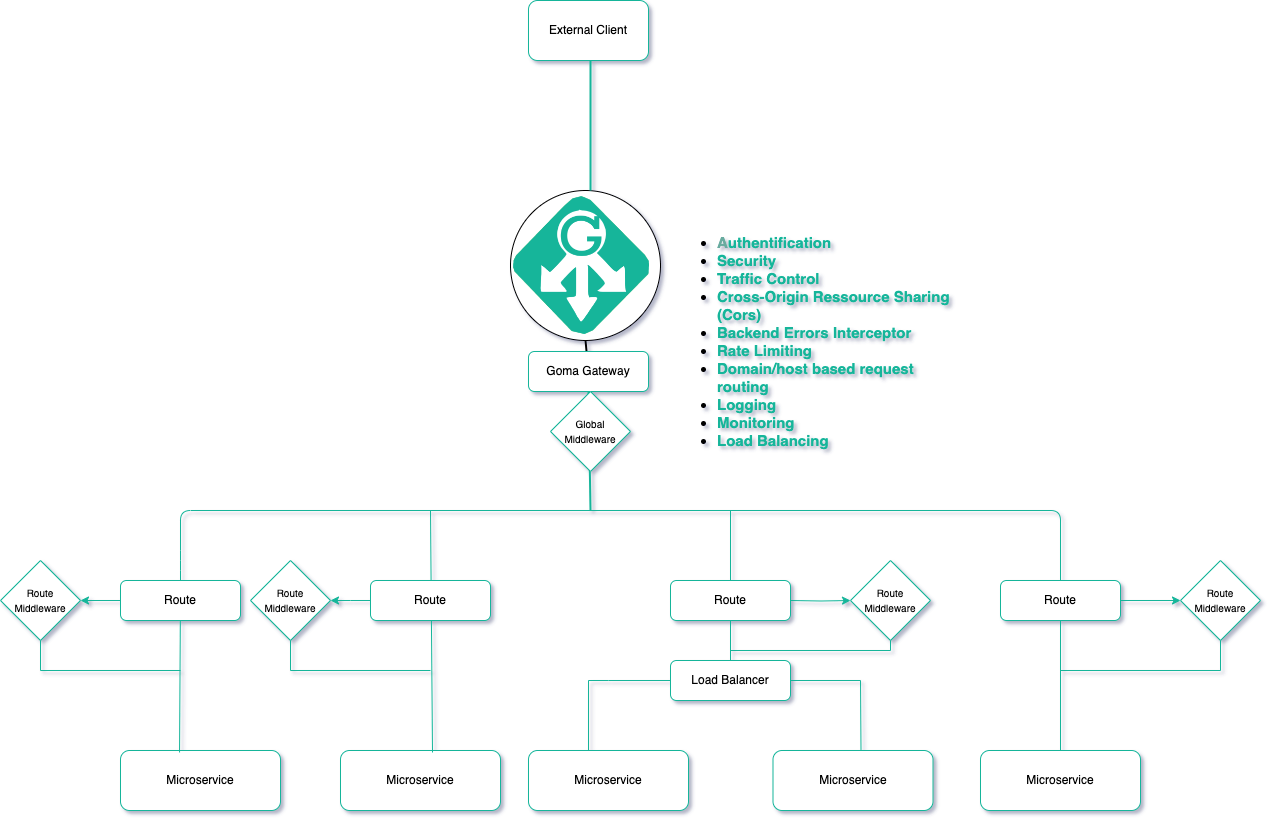
Core Capabilities
Routing & Traffic Management
Declarative YAML-based configuration
Flexible routing for domains, hosts, paths, WebSocket, gRPC, TCP/UDP
Multi-domain & multi-service support in one config
Reverse proxy with backend abstraction
Traffic control: rate limiting, load balancing, health checks
Canary Deployments: Safely roll out new versions of your services with advanced canary deployment strategies:
Weighted Backends – Gradually shift traffic between service versions using percentage-based routing.
Conditional Routing – Route requests based on user groups, headers, query parameters, or cookies for targeted rollouts.
Security & Access Control
Automatic HTTPS via Let’s Encrypt or custom TLS
Mutual TLS (mTLS) for client certificate authentication
Built-in authentication: Basic Auth, JWT, OAuth, LDAP, ForwardAuth
CORS policies, header injection, fine-grained access control
Exploit protection: SQL injection, XSS, and bot detection
Method restrictions and regex-based URL rewriting
Performance & Reliability
HTTP caching (in-memory or Redis) with smart invalidation
Load balancing: round-robin, weighted, with health checks
Scalable rate limiting: local or Redis-based (with automatic banning for repeated abuse)
Operations & Monitoring
Zero-downtime config reloads
Structured logging with configurable levels
Prometheus/Grafana metrics
Graceful error handling and backend failure interception
Cloud-Native Integration
Kubernetes CRD support for native resource management
GitOps-friendly with version-controlled configs
Modular config files for organized route management
Horizontal scalability & dynamic backend updates
Why Choose Goma Gateway?
Goma Gateway isn’t just another reverse proxy; it’s built for modern workflows:
Simple, Declarative Configuration: Clean YAML config that’s easy to read, version-controlled, and automatable.
First-Class Security: TLS, authentication, exploit protection, and access control baked in.
Live Reload & GitOps-Ready: Perfect for CI/CD pipelines.
Observability from Day One: Logging and metrics built in.
Cloud-Native: Seamless integration with Kubernetes.
Perfect for: Public APIs, internal microservices, legacy modernization, or any project requiring secure, scalable traffic management.
Quick Tutorial: Deploying Goma Gateway as a Reverse Proxy for Docker Services
Prerequisites
Make sure you have:
Docker installed
Basic knowledge of YAML config
Step 1. Generate a Default Config
docker run --rm --name goma-gateway \
  -v "${PWD}/config:/etc/goma/" \
  jkaninda/goma-gateway config init --output /etc/goma/config.yml
This creates config/config.yml with default settings.
Step 2. Customize Your Configuration
Example config.yml:
version: 2
gateway:
  entryPoints:
    web:
      address: ":80"
    webSecure:
      address: ":443"
  routes:
    - path: /
      name: api
      hosts: ["api.example.com"]
      target: http://okapi-api:8080
      middlewares: ["basic-auth", "rate-limit"]

middlewares:
  - name: basic-auth
    type: basicAuth
    rule:
      users:
        - username: admin
          password: $2y$05$TIx7l8sJWvMFXw4n0GbkQuOhemPQOormacQC4W1p28TOVzJtx.XpO
  - name: rate-limit
    type: rateLimit
    rule:
      unit: minute
      requestsPerUnit: 60

certManager:
  acme:
    email: admin@example.com
    storageFile: /etc/letsencrypt/acme.json
Step 3. Run with Docker Compose
compose.yaml:
services:
  goma-gateway:
    image: jkaninda/goma-gateway
    command: -c config.yaml
    restart: always
    ports:
      - "80:80"
      - "443:443"
    volumes:
      - ./config:/etc/goma/
      - ./letsencrypt:/etc/letsencrypt

  okapi-api:
    image: jkaninda/okapi-example
    restart: always
Your gateway is now live, ready to route, secure, and monitor your services.
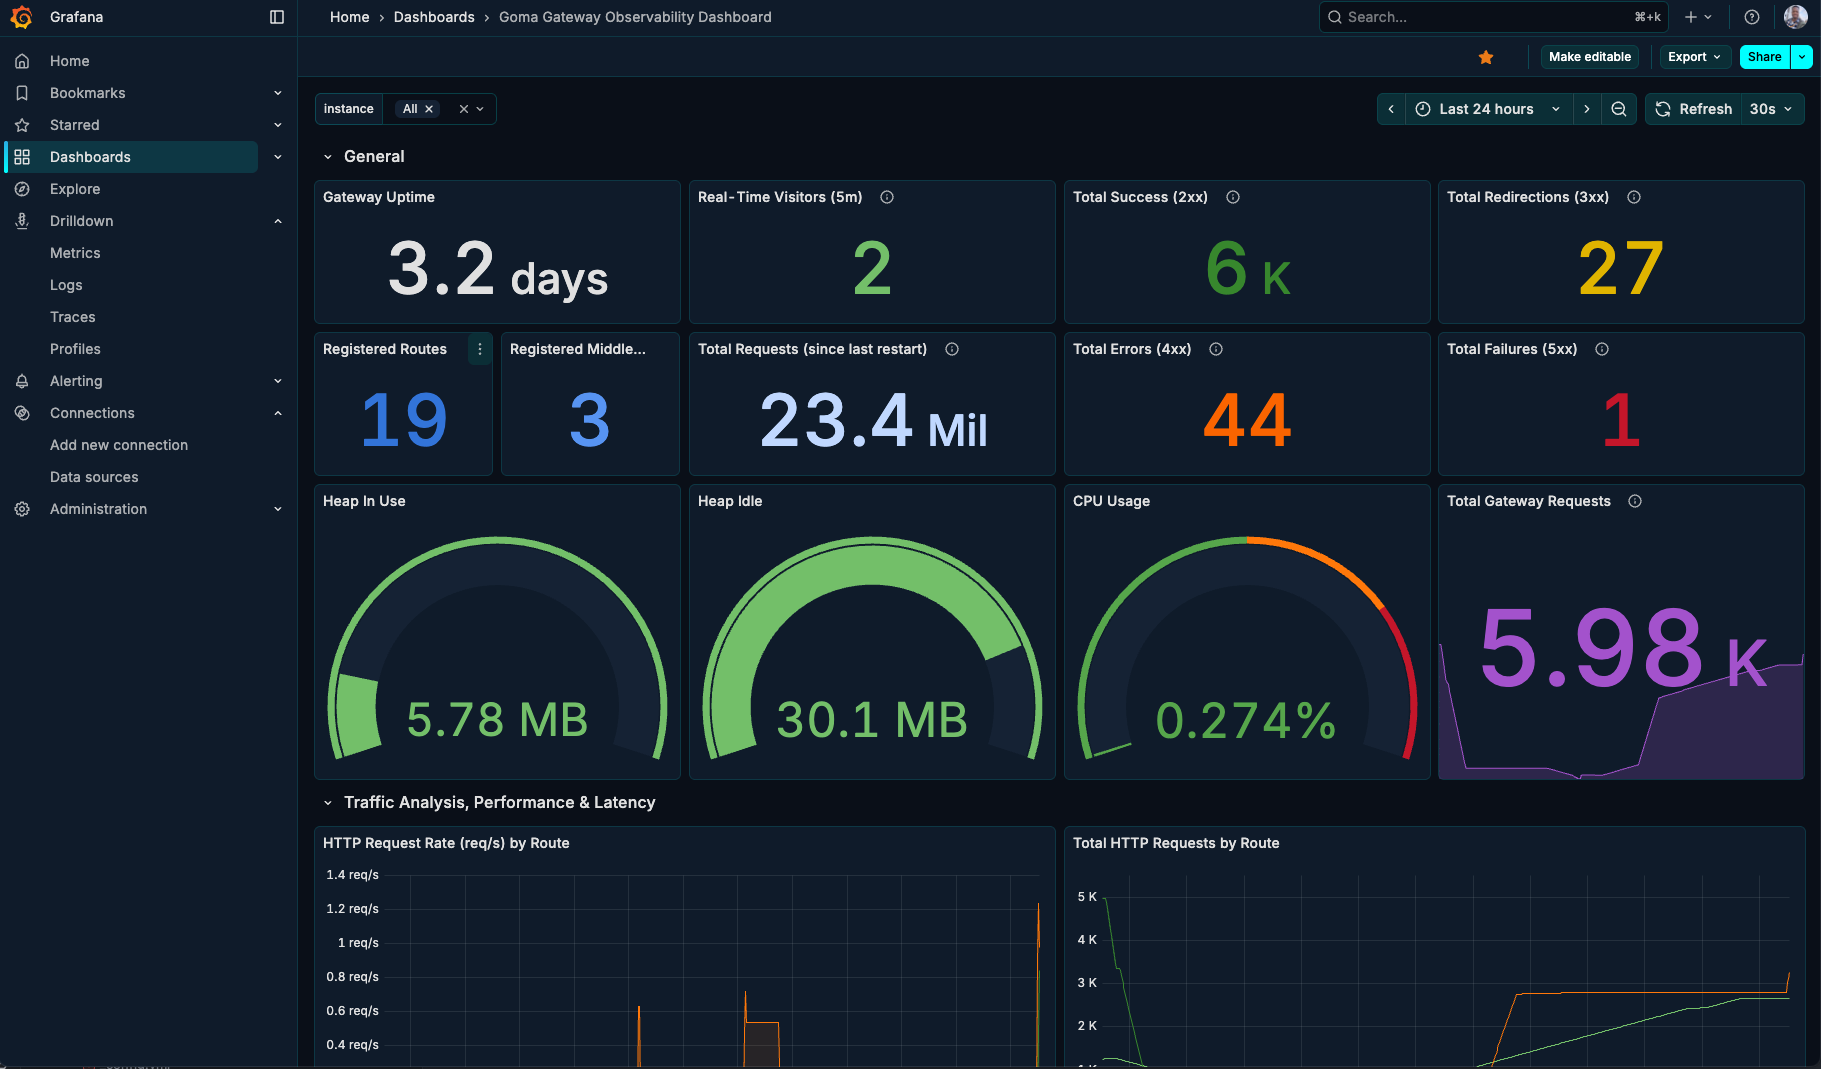
Step 4. Grafana Dashboard
Goma Gateway includes built-in monitoring to track the health, performance, and behavior of your gateway and its routes.
Metrics are exposed in a Prometheus-compatible format, making them easy to integrate with Prometheus and visualize using Grafana.
A prebuilt Grafana dashboard is available for quick setup and visualization.
You can import it directly using:
Dashboard ID: 23799
Enable metrics
version: 2
gateway:
  # Timeout settings (in seconds)
  timeouts:
    write: 30
    read: 30
    idle: 30
  # Optional, default port 8080
  entryPoints:
    web:
      address: ":80"
    webSecure:
      address: ":443"
  monitoring:
    enableMetrics: true
    metricsPath: /metrics
  extraConfig:
    directory: /etc/goma/extra # Directory containing extra config files
    watch: false # Watch for changes in extra config directory and reload after changes
Dashboard Preview
Links
GitHub: jkaninda/goma-gateway
Docker Hub: jkaninda/goma-gateway